


APIs in Web and mobile applications are the rising trend today. One impact of this trend is that a huge amount of commerce today takes place through APIs. These APIs eventually add to your business value.
Well, API performance can directly affect a business, hurting brand image or cutting into revenue as customers struggle to complete their action. What if in your website, pages are taking too long to load. What if your mobile app is taking to long time to load data from server ? How will you know that your APIs are performing slower ? In worst case, It may happen that your server starts taking more and more time and one night at 2:00 a.m – It crashes! Users of the application will be not happy, loss of business to website or application owners..! Surely, It did not happened all of sudden at 2:00 a.m.
So, as APIs become more and more important, we are clearly going to need the some information to determine if all the APIs you are using or providing are working properly and how they performing ? That’s why, we as developer, manager or project stack owner, need to have API response time monitoring in place for live project. Doing this enables us to know how much time our APIs are taking to respond back to request. If it starts taking more time, then developers can figure it out and fix it before it leads to worst case.
I recently configured a real time API response time monitoring in one of our live projects at Aubergine solutions. In this post, I will be sharing the implementation plan along with configuration of each tool required.
First of all, your API server needs to have logs with response time in it. If you are using nginx, you need to make some changes in nginx.conf file define a new log format timed_combined which captures some additional data in your logs with response time:
log_format timed_combined '$remote_addr - $remote_user [$time_local] '
    '"$request" $status $body_bytes_sent '
    '"$http_referer" "$http_user_agent" '
    '$request_time $upstream_response_time $pipe';
In my setup, I have django application running with nginx and uwsgi. I have used uwsgi log file which has following structure for log.
[pid: 2493|app: 0|req: 24480/48984] 127.0.0.1 () {36 vars in 516 bytes} [Sat May 6 04:50:43 2017] GET /api/users/2/ => generated 1710 bytes in 53 msecs (HTTP/1.1 200) 4 headers in 134 bytes (1 switches on core 0)
Introduction to the tools
Now, let’s have quick introduction to the tools I have used for monitoring setup.
Filebeat
- Filebeat is the ELK Stack’s next-gen shipper for log data, tailing log files, and sending the traced information to Logstash for parsing or Elasticsearch for storage. Read more here.
- We need to setup filebeat on api servers to ship log data to the server which has logstash installed.
Logstash
- Logstash is an open source, server-side data processing pipeline that ingests data from a multitude of sources simultaneously, transforms it, and then sends it to your favorite “stash.” (We will use Elasticsearch). Read more here about Logstash here.
- We will use it to parse each log line and extract necessary information which we can index using elasticsearch.
Elasticsearch
- Elasticsearch is a distributed, RESTful search and analytics engine capable of solving a growing number of use cases.
- We will use it to store parsed log data.
Grafana
- Open source software for time series analytics
- We will use to view and monitor beautiful graphs.
Now, let’s install them.
Installation steps
Elasticsearch
- Download and install the public signing key
wget -qO — https://artifacts.elastic.co/GPG-KEY-elasticsearch | sudo apt-key add -
- You may need to install the apt-transport-https package on Debian before proceeding
sudo apt-get install apt-transport-https
- Save the repository definition to /etc/apt/sources.list.d/elastic-5.x.list
echo “deb https://artifacts.elastic.co/packages/5.x/apt stable main” | sudo tee -a /etc/apt/sources.list.d/elastic-5.x.list
- install the Elasticsearch Debian package
sudo apt-get update
sudo apt-get install elasticsearch
- Use the update-rc.d command to configure Elasticsearch to start automatically when the system boots up
sudo update-rc.d elasticsearch defaults 95 10
sudo -i service elasticsearch start
Logstash
- Logstash needs JVM. So first install java and set JAVA_HOME. After that do :
wget -qO — https://artifacts.elastic.co/GPG-KEY-elasticsearch | sudo apt-key add -

sudo apt-get install apt-transport-https

echo “deb https://artifacts.elastic.co/packages/5.x/apt stable main” | sudo tee -a /etc/apt/sources.list.d/elastic-5.x.list

sudo apt-get update

sudo apt-get install logstash
Filebeat
wget https://artifacts.elastic.co/downloads/beats/filebeat/filebeat-5.2.2-amd64.deb

sudo dpkg -i filebeat-5.2.2-amd64.deb
Grafana
wget https://s3-us-west-2.amazonaws.com/grafana-releases/release/grafana_4.2.0_amd64.deb

sudo apt-get install -y adduser libfontconfig

sudo dpkg -i grafana_4.2.0_amd64.deb
Configuration
Elasticsearch
- Create index on elasticsearch. Index name should be same as you have mentioned in output block in logstash.
curl -XPUT 'localhost:9200/api_logs?pretty' -H 'Content-Type: application/json' -d'
{
    "settings" : {
        "index" : {
            "number_of_shards" : 3,
            "number_of_replicas" : 2
        }
    }
}
Filebeat
Change input path to point a valid log file. Config file is located at ‘/etc/filebeat/filebeat.yml’
filebeat.prospectors:
- input_type: log
 paths:
 — /var/log/uwsgi.log
Change name option. It can be used to filter logs based on their source.
Enable output to logstash by removing comment. Replace Ip address with logstash server’s ip-address. Make sure that logstash server is listening to 5044 port from api server.
output.logstash:
  hosts: [“xxx.xxx.xxx.xxx:5044”]
Logstash
- Create logstash.conf file inside /etc/logstash/conf.d/ directory.
- A Logstash config file has a separate section for each type of plugin. For example :
input {
 …
}
filter {
 …
}
output {
 …
}
Input
- You can specify source of data in input block of config file. Few options are file,syslog,redis,beats. As we have mentioned earlier, that we are going to use filebeat to ship logs from application server to logstash server. So we need to configure beat as an input option in config file.
input {
   beats{
     port => “5044”
   }
}
- Make sure your server (which is running logstash) is accepting TCP connection on port 5044.
- If you are not using filebeat for log shipping then you can directly use log file as an input option. In this case, you need to install logstash on your application server itself.
input {
   file {
      path => “path/to/log/file”
      start_position => “beginning”
      type => “logs”
   }
}
Filters
Filters are intermediary processing devices in the Logstash pipeline. You can combine filters with conditionals to perform an action on an event if it meets certain criteria. Some useful filters include:
- grok: parse and structure arbitrary text. Grok is currently the best way in Logstash to parse unstructured log data into something structured and queryable. With 120 patterns built-in to Logstash, it’s more than likely you’ll find one that meets your needs!
- mutate: perform general transformations on event fields. You can rename, remove, replace, and modify fields in your events.
- drop: drop an event completely, for example, debug events.
- clone: make a copy of an event, possibly adding or removing fields.
- geoip: add information about geographical location of IP addresses (also displays amazing charts in Kibana!)
We are going to parse logs generated by uwsgi. We will use grok to do it. Below is the sample log line for uwsgi logs.
[pid: 2177|app: 0|req: 6/8] 127.0.0.1 () {42 vars in 675 bytes} [Fri Mar 3 05:20:00 2017] GET /api/users/3/ => generated 669 bytes in 16 msecs (HTTP/1.1 200) 4 headers in 134 bytes (2 switches on core 0)
We need to write following code in filter block in order to parse above line.
filter {
   grok{
     match=>{
       “message”=>”[pid: %{NUMBER:pid}|app: %{NUMBER:id}|req: %{NUMBER:currentReq}/%{NUMBER:totalReq}] %{IP:remoteAddr} (%{WORD:remoteUser}?) {%{NUMBER:CGIVar} vars in %{NUMBER:CGISize} bytes} %{SYSLOG5424SD:timestamp} %{WORD:method} %{URIPATHPARAM:uri} => generated %{NUMBER:resSize} bytes in %{NUMBER:resTime} msecs (HTTP/%{NUMBER:httpVer} %{NUMBER:status}) %{NUMBER:headers} headers in %{NUMBER:headersSize} bytes %{GREEDYDATA:coreInfo}”
}

   add_field=>{
       “logtype”=>”api_request”
   }
}
# By default grok will add fields as string, but in order to apply
# elastic search aggregations, we need to convert data types.

mutate {
    convert => { “status” => “integer” }
    convert => { “resTime” => “float” }
}

# adding extra field “API” to output of this parsing
# It will help us filter data for this particular API endpoint.
# similarly, we can add other API endpoint also.

if [uri] =~ /api(/v2)?/users/[0–9]//{
      mutate{
        add_field=> [ “API”, “/api/users/<user_id>/”]
      }
  }
}
Output
- In the output section, you can specify where to send processed log data. That output option could be elasticsearch, file, graphite and statsd.
output {
    elasticsearch {
      hosts => [ “localhost:9200” ]
      index => “api_logs”
    }
}
- You can replace localhost with any other IP on which your elasticsearch is running and listening on port 9200.
- Replace index name with your index in which you want to store log data.
Final step
After all configuration is done, you can proceed with starting all of them one by one.
sudo service elasticsearch restart
sudo service logstash start
sudo service filebeat start
Now, make some API calls to your api server and check if they are being parsed successfully and they are stored in elastic-search index.
Grafana
- If grafana is installed successfully (steps written above), do start grafana server by following command.
sudo service grafana-server start
- By default, It will run on port 3000 . If you have installed it on localhost than you can access it here : http://localhost:3000
- It will show you grafana UI with sign up option. Register your self.
- After registration follow steps as per Grafana UI.
- You will be asked to create Organisation first.
- Now, Create datasource.
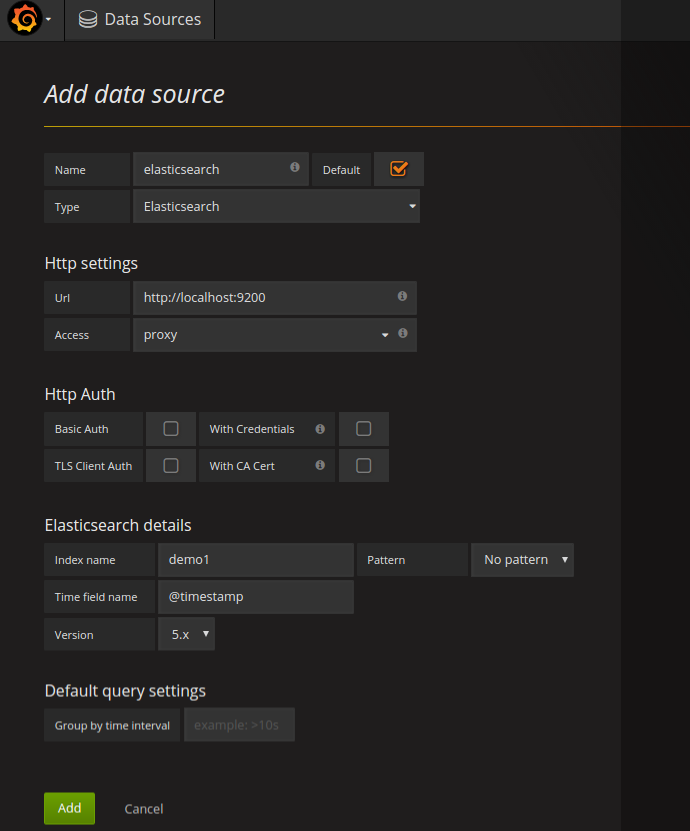
- Create Dashboard
- Add panel to it
- Select on Graph
- Edit Graph to display the result as you want.
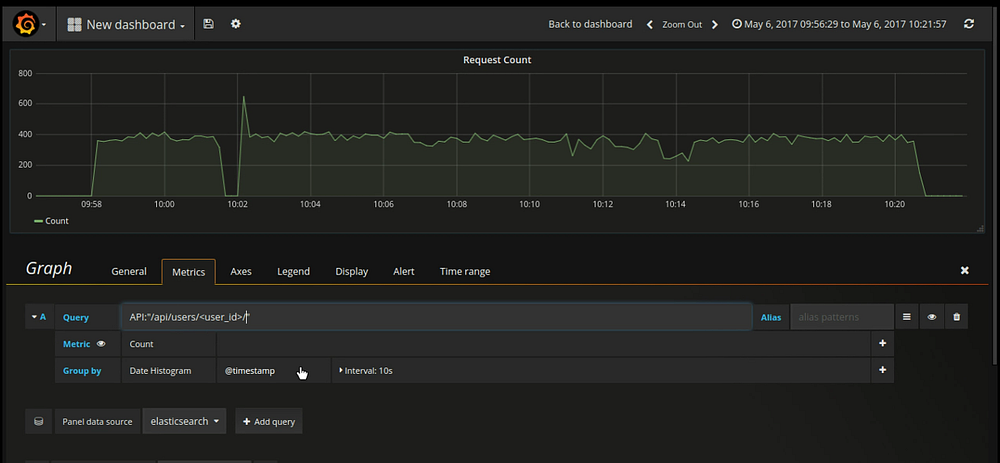
- Under the metrics tab, enter query which you want to give in order to filer data from elasticsearch.
- Query : API:”/api/users/<user_id>/”
- Note: This filter will only work if we have added this extra key “API” during logstash filter process. It will filter out all the log entried related to this particular API end point.
- There are many other config/options for graph panel. You can explore it.
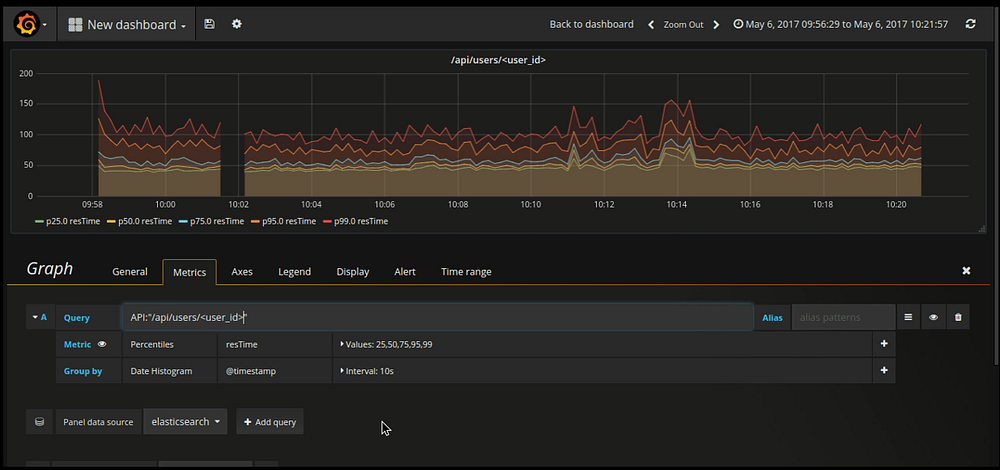
- Similar way, I have configured response time graph for endpoint ”/api/users/<user_id>/”
After saving this two graphs you will have something similar to below dashboard.
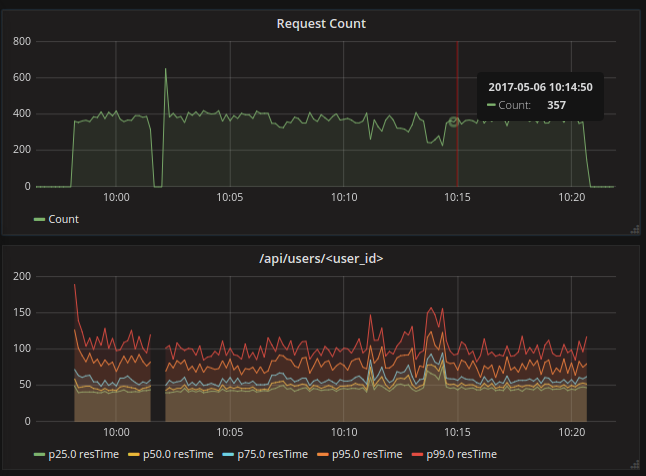
That’s It. This is how I have configured API response time monitoring.
Also read: Securing Your Elastic Beanstalk Web Application with HTTPS: A Load Balancer-Free Approach